Capital is global and investment decisions are made on a global basis. Large institutions review the relative merits of different asset classes across different regions, countries and cities.
Real estate is no different and institutional investors are increasingly comparing the merits of investing in the likes of London versus Tokyo, New York or Sydney.
We looked at the relative size of different markets to give a true picture of the global opportunity and to also consider the impact of global capital flows.
Global markets
North America accounts for a little more than 50 per cent of the total global real estate market, Europe just over 30 per cent and the Asia-Pacific (APAC) 15 per cent. America is primarily a domestic market, with less than a quarter of capital raised from American investors typically going outside the region.
In comparison, nearly half of the capital invested in Europe comes from outside the region making it the main destination for cross-border investment. APAC is more of an intra-regional market but is also a significant exporter of capital.
Even though the percentage of North American capital invested internationally is relatively low, the sheer size of the domestic market means that the amount invested dwarfs other regional flows.
Better economic performance in the US and the improved purchasing power of the US dollar is also supporting the flow of US capital into other regions.
APAC investors have the strongest appetite for outbound investment proportionate to their (much smaller) market size, although investors in this region are likely to slow the pace of building up their global property holdings after expanding rapidly in recent years.
The top destinations
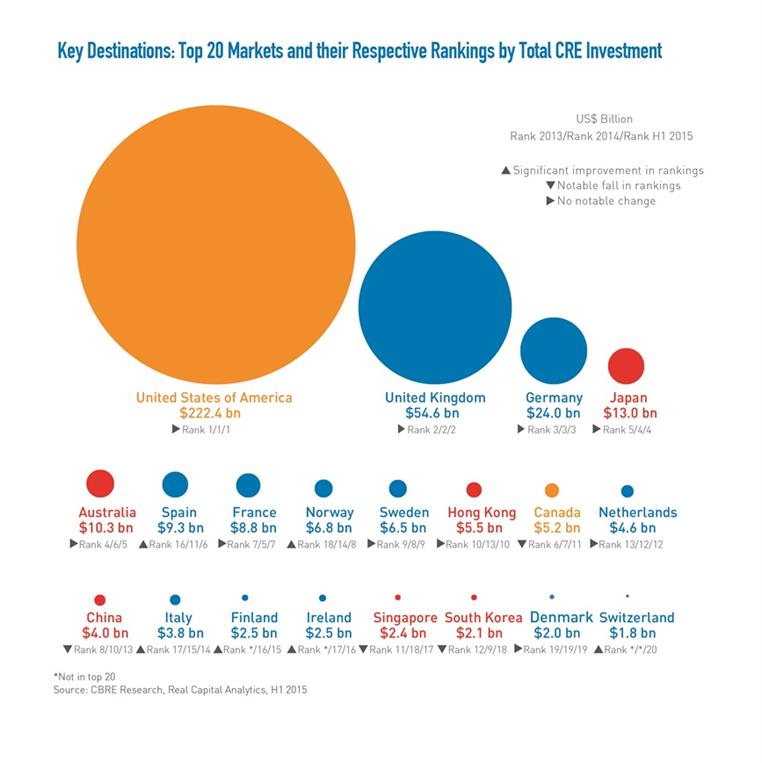
In 2015, the top three, America, the UK and Germany, accounted for nearly 75 per cent of the total global commercial real estate market, substantially above their long-term average of approximately two thirds (65 per cent).
Four of the remaining countries in the top 10 are European, with Japan (4th), Australia (5th), and Hong Kong (10th) comprising the APAC contingent.
Understanding Australia
As a destination, Australia ranked 5th in 2015, significantly ahead of other substantially larger markets. Australia’s total commercial office market for example, is 17 million square metres (sqm) of net lettable area, compared to Paris alone, which has over three times this amount (53 million sqm) in the context of a wider European market opportunity of over 500 million people.
Australia punches above its weight due to its perceived safety as an investment destination, the sophistication and liquidity of its real estate market and the relative high face yields when compared to other popular investment destinations.
The impact of this has been felt over the last few years as a ‘wall of international capital’ has snapped up an increasing share of the residential and commercial property market.
The large flow of capital into a relatively small market has compressed yields to historic lows but has not yet seemed to impact on Australia’s popularity as an investment destination.
Overall, in most cases there is a clear linear relationship between market size, liquidity and capital allocation. Those markets that are larger simply have more opportunity to both attract, and also export, larger amounts of capital.

Key Destinations: Top 20 Markets and their Respective Rankings by Total CRE Investment
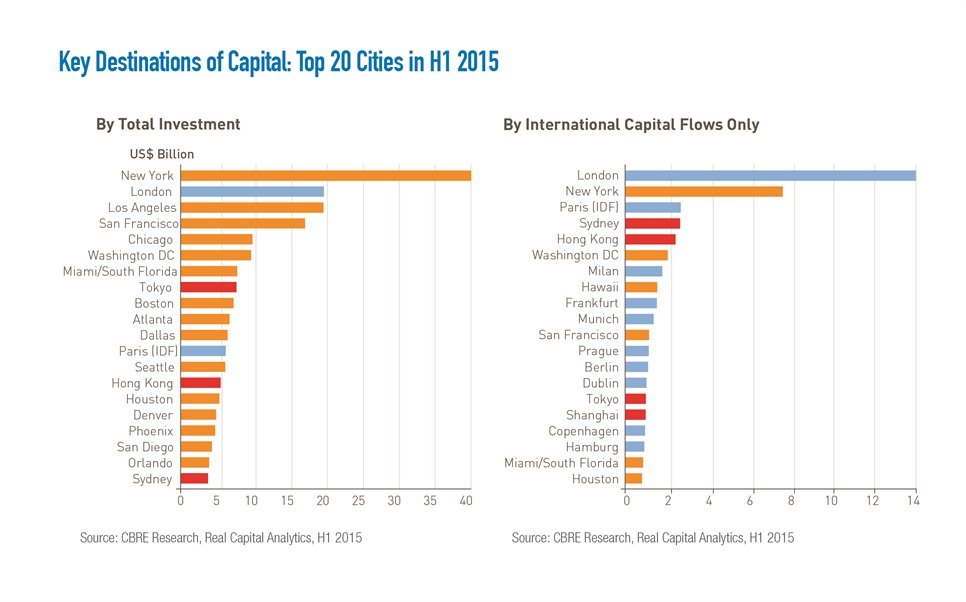
A quick look at the world’s top 20 largest cities in terms of total commercial real estate investment, compared to the top 20 locations in terms of international capital flows, helps to understand how cross-border investors are changing the shape of the market.
The list of top 20 international destinations in 2015 comes across as a balanced mix of cities across all main regions, with half of all locations being European.
This contrasts with the overall top destinations where, due to the size of the domestic market, the bias is strongly on the USA.
Key destinations of capital: top 20 cities in H1 2015

Bevan Towning is the head of wholesale unlisted funds at Cromwell Property Group.


