At a recent presentation I was giving on the global economy and markets, I was asked where the biggest risk issues lay. To put it simply the standout issues are:
- The nature of the apparent current global upturn that is predicated by the positive nature of most leading indicators around the globe; and
- The positive market reaction to Trump.
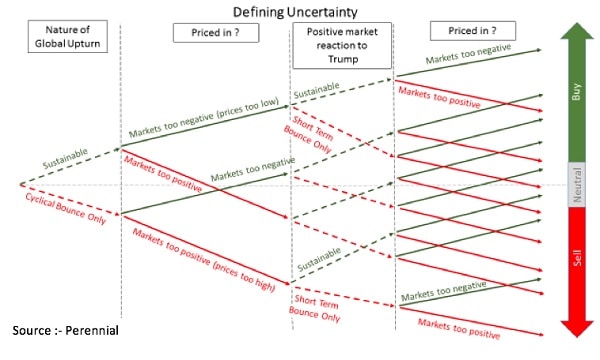
The key questions then centre around whether these two seemingly positive factors are sustainable or simply a short-term bounce and how much of this good news is already priced-in to equity markets.
Although this big picture example seems very simple, the answers to these key questions can produce a range of outcomes in terms of assessing the attractiveness of shares today. The following graphic illustrates this as a simple decision tree.
Factor 1 – The current global upturn
The US Federal Reserve’s Federal Open Market Committee’s decision on 16 March to increase rates illustrates the confidence the Fed has in the nature of the US upturn.
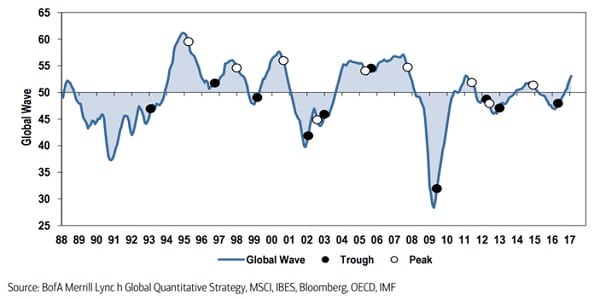
In terms of the global picture, Bank of America Merrill Lynch put together a “Global Wave” index that takes into account various factors including Global Industrial Confidence, Global Consumer Confidence, Global Capacity Utilisation, Global Unemployment, Global Producer Prices, Global Credit Spreads and their Global Earnings Revision Ratio.
From the graph below you can see the recent spike in the Global Wave, which is generally a positive signal for share markets.
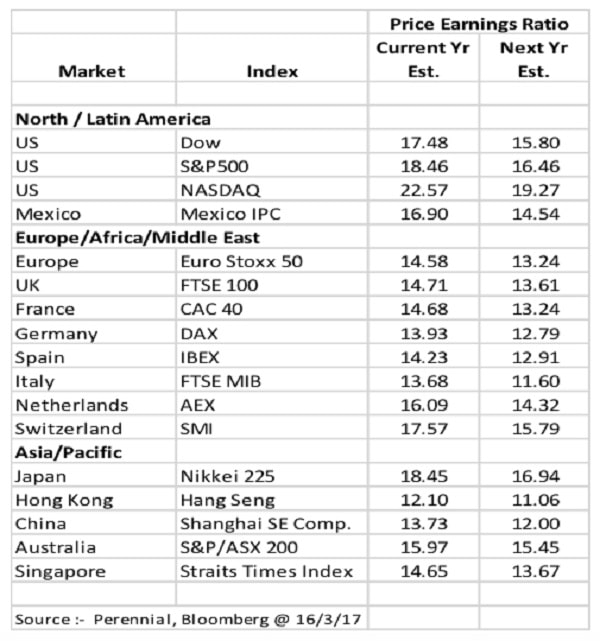
In terms of what’s priced in, price/earning (PE) ratios are generally slightly ahead of longer term averages as shown in the following table, implying that some of the good news is priced in.
While interest rates have risen somewhat, the lower interest rate environment we look like being in for some time yet can support PEs that are higher than average.
However, to assume all is well in terms of valuations would not be sensible when one looks at other popular measures of relative valuation.
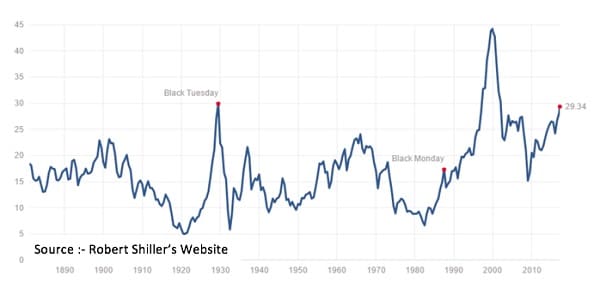
Robert Shiller’s Cyclically Adjusted Price Earnings (CAPE) looks at current prices divided by the average of the last 10 years’ inflation adjusted earnings and there is a loose correlation between investing when this index is low and subsequent good returns, although Shiller does stress that this is not a short-term indicator for market timing.
On this measure the US market looks stretched, although it is fair to say that the last few years of sluggish growth, low interest rates and the threat of deflation has been prolonged and extreme, and with low interest rates still a factor valuations could stay elevated according to this measure.
In addition, the 10-year number would include the extremes of the GFC and the earnings numbers will improve as more positive quarters of earnings are added to the measure.
Warren Buffett’s preferred measure of the overall state of US stocks is based on the level of profits of US companies as a percentage of GDP.
This makes intuitive sense in that you would imagine that US profits should settle at a long-term average percentage of the entire economy and, as you can see, it does fluctuate between 3 and 11 per cent, as shown in the chart below (which tracks data to the third quarter of 2016 and US recessions are shown as the shaded bars).

As with the Shiller measure, this does point to relatively high current valuations in the US. Back home the Australian “CAPE” measure sat around 16.8 at the beginning of the year, according to Star Capital.
Overall markets looked to be fully priced with the US looking expensive on some measures and a lot depends on the forecasted continued growth in economies and earnings materialising.
Factor 2 – Trump
It was a welcome turnaround earlier this month tuning in to the congressional address to see Trump doing the speaking with the market doing the tweeting for a change.
So what was revealed? In all honesty, not much that was new at all – lots of ‘political’ statements (similar to many new president’s initial Congress addresses) with still little in the way of detail.
Below is a 20-second, headline summary:
- America’s own citizens first, making America great again
- Construction of a “great, great wall”
- “Big, big” cut in corporate tax
- “Massive tax relief for the middle class”
- Belief in free trade “but it has to be fair trade”
- Infrastructure, “$1 trillion investment” (public and private)
- Child care accessible and paid family leave
- “One of the largest increases in the military budget”
- “Repeal and replace Obamacare”
There was no mention of the Border Adjusted Tax and an apparent softening on trade policy in terms of what was not said.
The obvious question here is can these ambitious reforms be enacted and paid for in a way that creates enough growth and prosperity to justify the likely debt/budget burden?
Certainly markets have been very positive since the Trump election.
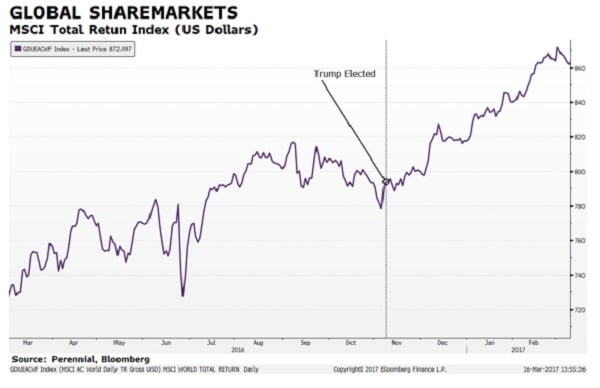
The thorny question on how much of the Trump effect is priced in is almost impossible to guesstimate given the lack of detail we have around Trump’s actual policies, other than the fact that they appear to be “market friendly”.
So what to make of all this – I’d be watching these two factors carefully – go back to the first chart and follow your own decision tree to start thinking about where your portfolio is positioned for these interesting times. Given Trump’s tweet first, ask questions later approach, the next major risk issue could be just another tweet away!
Brian Thomas is the general manager of investment services at Perennial Value.


