Ten-year rates have fallen below short-term rates in the US, Canada, and the UK – and are essentially flat in Australia. Concern is growing among investors, corporations, and central bankers that recession may be on the horizon.
Recessions are bad for stock returns for several reasons. First, they are associated with slower economic growth, which is a negative for companies’ cash flows. Second, recessions bring times of much uncertainty, and heightened risk is nearly always associated with lower stock prices. While much of the discussion has focused on the US economy, US recessions are bad for every country that does business with the US.
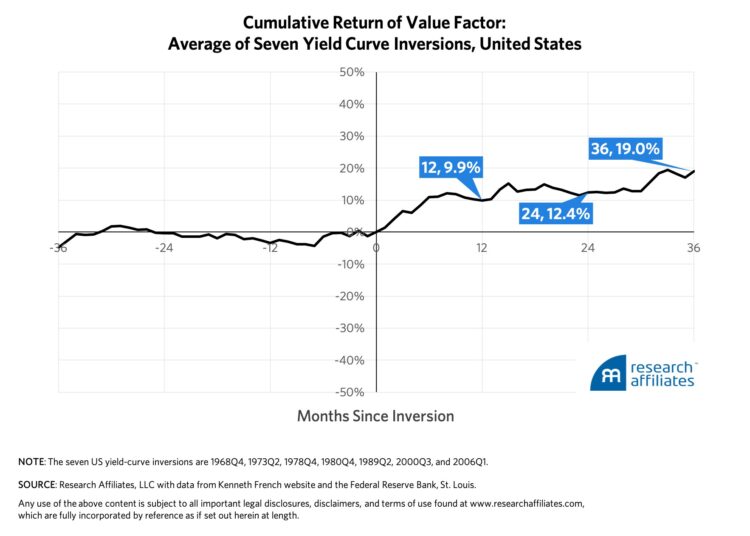
But within this scenario, there is opportunity for investors. Despite poor stock market returns, our analysis shows that value investing, or buying stocks with low price-to-earnings ratios, as far out as three years following a yield curve inversion, can outperform growth investing, that is, buying stocks with high price-to-earnings ratios, over the same time frame.
Indeed, over the last 10 years, a small number of tech growth stocks – the FAANGs (Facebook, Amazon, Apple, Netflix, and Google) – have accounted for most of the gains in the US stock market. Historically, that reverses after yield curve inversions. The inversion in the third quarter of 2000 is a spectacular example.
The relationship among the factors at play – economic outlook, interest rates, and corporate earnings – even if studied using US data, should have a reasonably similar outcome in many other countries. And of course, what happens in the US markets has a spillover effect to many other countries, such as Australia.
The figure below shows how the value factor has performed versus growth stocks, on average, before and after the last seven US yield curve inversions. The value factor is a long/short portfolio that holds long positions in stocks deemed to be undervalued by the market and sells short positions in stocks deemed overvalued.
Will this time be different?
No, I don’t believe it will. First, my model has worked consistently over the business cycles in the US since 1968. Its predictive ability has not faltered.
Second, some have suggested that the US central bank’s buying of bonds – quantitative easing – and subsequent selling of these bonds over the last couple of years, have altered the landscape. Selling should lead to lower prices and higher yields. We’ve seen the opposite.
I believe the drop in longer rates is a flight to quality, a direct result of fears about the future economic outlook. The heightened rhetoric and movement toward anti-trade and anti-growth policies in the US and in Europe – the latter primarily a result of Brexit contribute to the economic anxiety.
Indeed, the economic foundations of the yield curve’s ability to predict recessions is tightly linked to a flight to quality. The safest assets in the world are US Treasuries and when risk increases, investors pour into the 10-year Treasury. This drives up the price of the bond and its yield down, flattening or inverting the yield curve. Investors may also be liquidating shorter maturity bonds and reinvesting in the 10-year, which adds further pressure on the inversion, in anticipation of an economic slowdown.
Campbell Harvey, finance professor, Duke University and partner and senior adviser, Research Affiliates


