Early in November, even before AUSTRAC claimed Westpac did not comply with anti-money laundering laws 23 million times, the company shocked investors when it announced that it was cutting dividends for the first time since 2008 after its full-year 2019 cash profit fell 15 per cent to $6.85 billion. The bank slashed its final dividend to 80 cents from 94 cents a share. ANZ too recently cut the level of franking of its dividends to 70 per cent from 100 per cent while NAB cut its final and interim dividends to 83 cents a share from 99 cents for 2019.
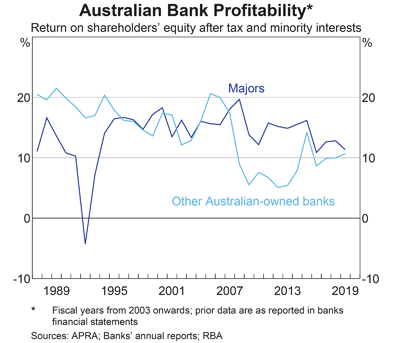
The big banks will most probably find it difficult to maintain existing payouts to shareholders given the economic climate of historically low interest rates and lacklustre economic growth. The graph below highlights that the big banks are much less profitable now than they were 10 years ago. The return on equity to shareholders has fallen from around 20 per cent in 2008 to close to 10 per cent at current levels. This is sounding alarm bells for investors looking for reliable income and capital growth. As the banks’ profitability falls, the risk is that shareholders will see more dividend cuts and even more capital losses on top of those they have already sustained.

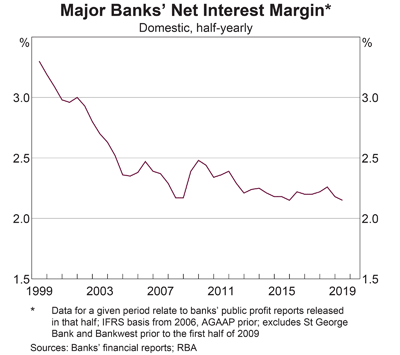
The chart below highlights that the big banks’ net interest margins (NIM) have also dropped to their lowest level of around 2 per cent, which is putting downward pressure on their profits. Falling NIMs and a rising regulatory spend in the aftermath of the Hayne royal commission are combining to reduce banks’ profits.

The outlook for profitability is not good. Low interest rates are likely to persist for a long time in Australia and abroad. High levels of household debt in Australia will inevitably hamper future growth in earnings from mortgages and households save more. Household debt sits at around 190 per cent of household income, higher than in most other countries. While most households are comfortably making their debt repayments now, any shocks to the economy such as significant rise in unemployment could push some households over the edge.
Added to this are remediation costs for the banks associated with poor customer outcomes and regulatory non-compliance, which, according to Reserve Bank figures, have amounted to $7.5 billion across the financial sector over the past two years and are still rising. That figure does not count Westpac’s likely escalation in remediation costs, law suits and potentially record-breaking fine following AUSTRAC’S prosecution of its alleged 23 million breaches of anti-money laundering laws. APRA has also imposed additional capital requirements on the major banks to account for poor risk management practices. All of these are weighing on banks’ ability to make money.
This is sobering news for shareholders. Dividend cuts and falling share prices and profits are alarming outcomes for the many Australian investors whose portfolios have significant exposure to the big four, which represent around one-quarter of the S&P/ASX 200. In other words, if you hold a blue-chip portfolio or are invested in an active or passively managed Australian equity fund that tracks or is benchmarked to the S&P/ASX 200, $1 out of every $4 is likely to be invested in banks and therefore vulnerable to the risks they face. In the last month alone (to 4 December), Westpac shares are down 10 per cent and over five years, they have fallen 25 per cent. NAB shares are down 16 per cent and ANZ 23 per cent. Commonwealth Bank has lost a relatively modest 0.6 per cent. But these are dire financial outcomes for shareholders.
To reduce the concentration risk inherent in the Australian market, savvy investors have been investing in VanEck Vectors Australian Equal Weight ETF (ASX: MVW), which recently surpassed $1 billion under management.
MVW equally weights the largest and most liquid stocks on the ASX at each rebalance. As at 30 November 2019, MVW’s portfolio was 17.03 per cent underweight the big banks compared to the S&P/ASX 200. This has led to a convincing outperformance of the ASX 200 over five years and since inception.

Inception date is 4 March, 2014.
Source: Morningstar Direct, as at 30 November 2019. Results are per annum, calculated daily to the last business day of the month and assume immediate reinvestment of all dividends. MVW results are net of management fees and other costs incurred in the fund but do not include brokerage costs and buy/sell spreads incurred when investing in MVW. Past performance is not a reliable indicator of future performance.
The time maybe ripe for Australian investors to act and lighten their bank concentration, a risk inherent in the S&P/ASX 200, and many Australian equity portfolios.
Arian Neiron, managing director and head of APAC, VanEck
IMPORTANT NOTICE: This information is issued by VanEck Investments Limited ABN 22 146 596 116 AFSL 416755 (“VanEck”), which is the issuer of the VanEck Vectors Australian Equal Weight ETF (“fund”). This information contains general advice only about financial products and is not personal financial advice. It does not take into account any person’s individual objectives, financial situation or needs. Before making an investment decision in relation to the fund, you should read the applicable PDS available at www.vaneck.com.au or by calling 1300 68 38 37 and with the assistance of a financial adviser consider if it is appropriate for your circumstances. The fund is subject to investment risk, including possible loss of capital invested. Past performance is not a reliable indicator of future performance. No member of the VanEck group of companies gives any guarantee or assurance as to the repayment of capital, the payment of income, the performance, or any particular rate of return from the fund.


