Avoid assets that magnify market moves
As the over-quoted Warren Buffett has said: “The first rule of investment is don’t lose money, and the second rule is, don’t forget the first rule.” He has a way of reducing wisdom to its essence.
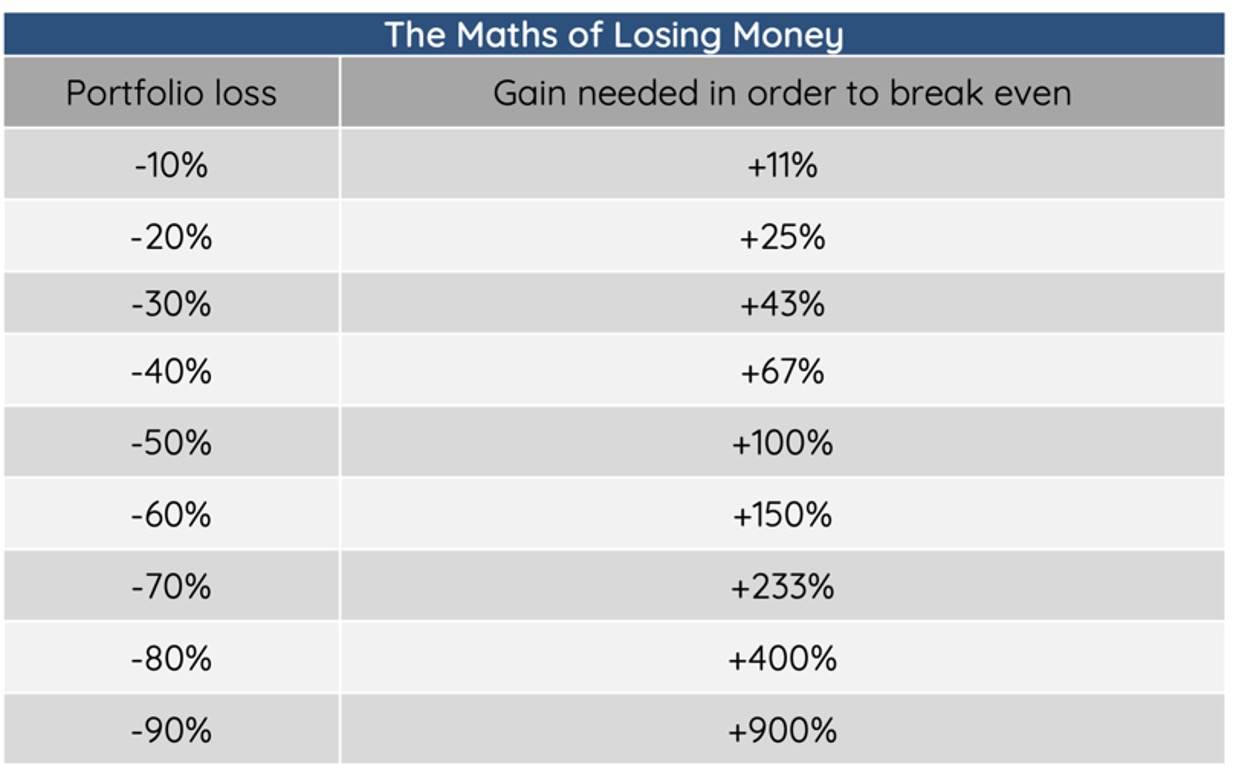
The math behind his rules is stark. An investor with $100 in the Nasdaq as of 1 January 2022 needs about a 43 per cent recovery to breakeven given the roughly 30 per cent fall year-to-date. The table below shows more examples.
The math of losing money

If you believe the market can fall further, it makes sense to avoid being in assets that move in the same direction as the market and with the same or greater magnitude. The short hand for this is to prefer low over high beta. High beta has its time but that is not today. We suspect investors have too much of it already and would do well to move the other way.
Own assets with shorter rather than longer payback periods
In a high inflation environment, it pays to own assets that allow you to recoup your investment sooner rather than later. This is because with inflation increasing, a dollar now is worth more than a dollar in the future. According to the math, when the discount rate - the rate used to determine the present value of future cash flows - is zero, $100 today is worth the same as $100 in ten years’ time.
However, when for example the discount rate is 2 per cent, $100 in ten years’ time is worth just $82. With rates at 4 per cent, which is closer to the long-run average on the US ten-year Treasury, then $100 in ten years is worth just $68. At higher rates, companies that generate the bulk of their cash flows far into the future are much less attractive.
One of the reasons value stocks have performed well over the last year is because the companies generate substantial cash flows in the near future. This makes them less sensitive to rising discount rates.
High-yielding assets also fit the bill. As we’ve discussed previously, investors would be well served focusing on income as a component of returns. In our world, income is not just interest on cash and dividends but option premium as well.
Do not try to pick the next fund winner
The standard way to look at a fund’s performance is to calculate the average annual return over a given period assuming the money was invested at the start of the period. Looking at one, three, six months’ and one, three, five, seven, and 10 years’ performance gives a sense of how a fund has done in absolute terms, its trend and how it compares with competing assets.
However, what this methodology misses, is the experience that most investors have had owning a fund. There are ways to show this. For example, the money-weighted average return considers the flow of money into and out of a fund over the period and thus measures the return for the bulk of the money.
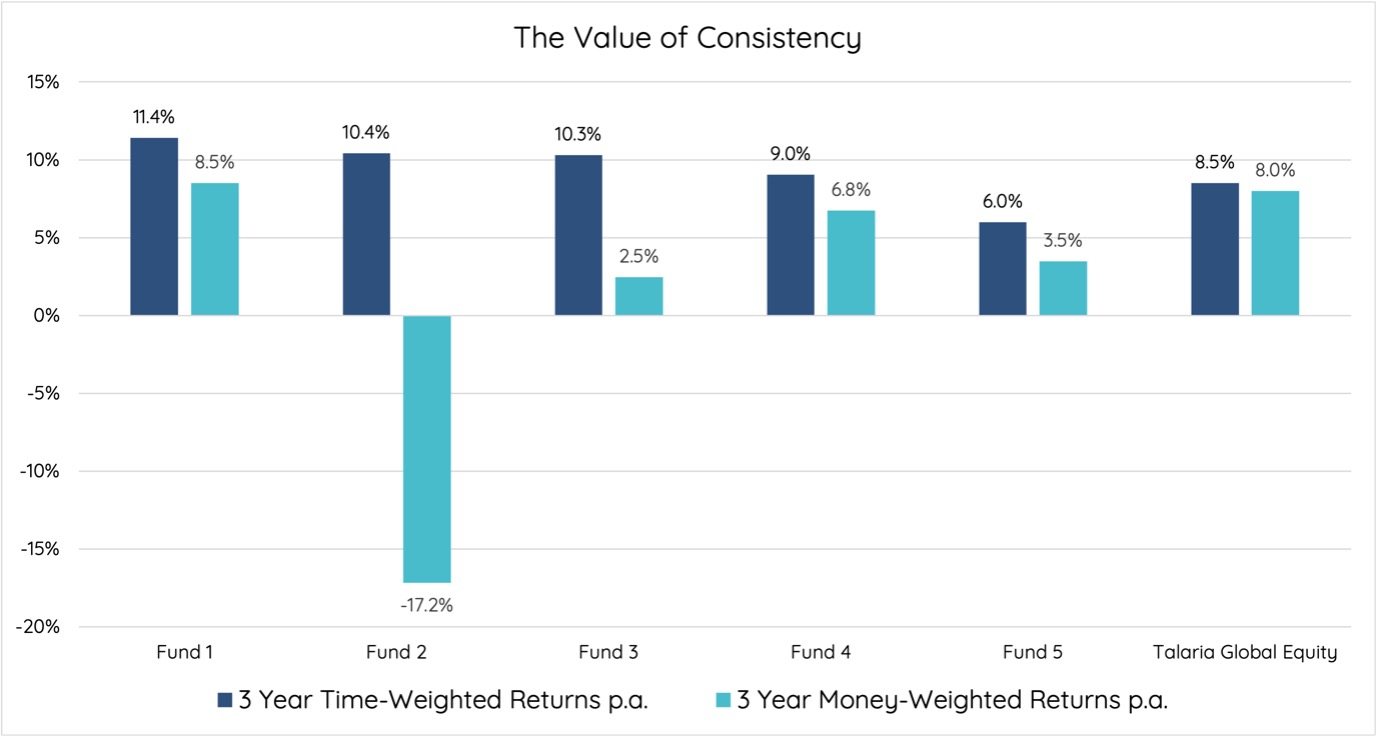
The chart below compares the time weighted returns and money weighted performance for some of the biggest global equities asset managers.

We would highlight three points:
-
The best performer of the group in time-weighted return is the worst in money-weighted. In fact, this does not do the position justice - the bulk of money owning one of the best performers was down over 17 per cent on their investment at the end of May. Investors own a fund that is up 10 per cent p.a. over the last three years and yet their experience of that ownership has arguably been poor.
-
Although the above example is extreme, in all cases, the money-weighted performance is below the time-weighted performance.
-
These data show the importance of low volatility and consistency of returns. With a fund that consistently moves up and down a lot, timing matters so much more than with a fund that moves in a narrower range.
And just to reiterate points 2 and 3 are much more powerful if you - as Warren said - don’t forget the first rule.
Hugh Selby-Smith, co-chief investment officer, Talaria Capital


